Computing Life's Family Tree

By Pam Frost Gorder
Call it yet another biological gold rush. When Charles Darwin published The Origin of Species in 1859, scientists began working in earnest to document the world’s plant and animal species and build a phylogeny —a map of how all those species relate to each other. More scientists came to the discipline in the 1980s, when automated DNA sequencing offered a new way to classify species and new applications for phylogenetics.
Thanks to such efforts, at least a small sample of genetic code is on file in databases worldwide for some 100,000 of Earth’s organisms. The largest such database, GenBank, contains more than 42.7 million genetic sequences, and counting. But scientists have yet to realize Darwin’s phylogeny; they’ve sampled genes piecemeal—a rice gene here, a mouse protein there—and have connected relatively few species.
Today, the newest prospectors in the gold rush are those with enough expertise in computing to connect all that genetic data in a meaningful way. The goal is the same as it was 150 years ago: build the ultimate family tree.
When Too Much Data Isn’t Enough
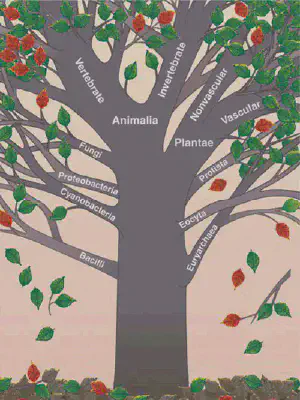
A complete genetic “tree of life” (see Figure 1) would not only provide an evolutionary map, but could also lead scientists to a new understanding of diseases, new drugs, and even new strategies for saving endangered species, explains Michael Sanderson, a biologist at the University of California, Davis.
The raw material for small sections of the tree is already available. Databases such as GenBank, which the US National Center for Biotechnology Information maintains, now catalog partial genetic sequences for 6 percent of the 1.7 million known plant and animal species. With millions of individual records, GenBank is a huge data set, but because it still lacks so many species, computer scientists consider it very sparse—it holds a lot of data, but a lot more is missing.
“The scale of the problem just cries out for elegant solutions at the algorithm level,” Sanderson says.
With help from colleagues, Sanderson and postdoctoral researcher Amy Driskell combined some publicly available algorithms to mine a subset of data from GenBank. In Science (vol. 306, no. 5699, 2004, pp. 1172–1174), they described how they constructed two small subtrees of 69 related plant species and 70 animals, despite much missing data.
To David A. Bader —who codirects the high-performance computing thrust of the Cyberinfrastructure for Phylogenetic Research (CIPRes) project at the University of New Mexico—the Science paper comes as a “wonderful surprise” because it means that scientists can exploit sparse genetic databases as a cost-effective way to assemble the tree.
Biologist Keith Crandall of Brigham Young University (see Figure 2) also feels that Sanderson’s strategy is a good one. “It’s a really neat idea because most people in the phylogeny reconstruction business assume that you need a complete data set.”
Given that in more than 20 years of trying, scientists have only been able to document partial records for a small percentage of known species, the likelihood of constructing a complete data set anytime soon seems small. In the meantime, species are going extinct—or, as Crandall puts it, “leaves are falling off the tree.” What’s more, experts speculate that many more species remain undiscovered, some of which could answer fundamental questions in biology and medicine. These notions all fuel the sense of urgency with which scientists are trying to build the tree from currently available data.
In 2002, the US National Science Foundation (NSF) launched a program called Assembling the Tree of Life (ATOL), which has received consistent funding. The expected amount available for 2005 is US 14 million, with another 15 million set aside for 2006. Individual projects can receive up to $3 million each.
So far, much of this funding has focused on constructing the tree’s deepest branches, Crandall says. To him, Sanderson’s work suggests that biologists can focus on detailing the smaller branches and twigs of the tree, whereas the data already in GenBank and elsewhere can fill in the larger structure—if scientists can find the right algorithmic strategy to connect that data.
Think Outside the Matrix
Scientists trying to build the tree face even bigger computational problems than an overabundance of sparse data; today’s high-performance computing techniques have their roots in the physical sciences, and life-science data are different.
As the CIPRes project’s Bader explains, the earliest supercomputers were designed to tackle simulations of atmospheric phenomena and nuclear weaponry—problems often computationally represented with a simple two- or three-dimensional matrix. Matrices make for efficient computing because the simulations draw on source data predictably. Related pieces of data are stored together in a cache—literally next to each other on the same computer chip—for fast retrieval.
A matrix won’t work for biology’s hierarchical, tree-shaped data structure. Similar data is grouped by branch, but the branches split at unpredictable intervals. Well-known techniques for exploiting caches often do little for these codes.
Bader and CIPRes director Bernard Moret have been working around the phylogeny problem with a combination of innovative algorithms and parallelization in a package called Grappa (Genome Rearrangements Analysis under Parsimony and other Phylogenetic Algorithms; http://phylo.unm.edu/). In 2000, they assembled the phylogeny of 13 members of the bluebell family of flowering plants on a 512-processor computer cluster, and achieved a billion-fold speedup from prior methods.
“The biologists that we were working with had computations on their data set that they estimated would take 250 years to compute if they just let their current computer run using an available program,” Bader recalls. “We can now solve a more biologically meaningful version of the same problem using the same data set in just five minutes on a laptop.”
Sanderson and his team built their tree using algorithms that searched for similar gene sequences among their selected species, then used the differences in those sequences to arrange the species relative to each other on the tree. He’s hoping that over the next two years, they can scale up the technique and produce trees with tens of thousands of species. Compiling all the GenBank species into one tree is a far more distant goal, but assuming he could, this would raise yet another problem: visualization.
“Imagine a tree with 100,000 species on it,” he says. “How are you going to look at the thing?”
Seeing Trees
Nina Amenta, computer science professor at the University of California, Davis, knows how most biologists would have to answer that question. “Say you want to look at a really big tree,” she begins. “It’s bigger than you can fit on your computer screen, bigger than you can fit on a piece of paper. What you’ll probably do is print it out on 10 pieces of paper and stick them together with Scotch tape and sit on the floor with highlighters and try to pick out the features of interest.”
Hardly a high-tech solution. She and Tamara Munzner, from the University of British Columbia, have written a program that might get biologists off the floor and back to their desks. The TreeJuxtaposer draws a large data tree that fits on a single computer screen; users can click on parts of the tree to zoom in. The selected part of the tree expands while the rest of it remains visible, so that users can still view the portion of interest in the context of the entire data set.
If scientists are working with a data set that allows more than one possible tree configuration, they can try the Tree Set Visualization program to help them sort through their choices. Amenta and Katherine St. John at the City University of New York designed the program to compare the characteristics of candidate trees and represent each as a point on a graph, with similar trees clustered together. The software lets biologists look at the phylogenies they’re studying in a whole new way.
“Sometimes you may have a group of trees that are similar, and if you compute the average tree structure for that cluster, that’s probably a pretty good answer,” Amenta says. “But if there are trees far outside that group, you have to wonder what makes them good competing hypotheses for this one dense cluster.”
Classifying the Phylogeneticist
On a recent March day, Crandall worked at home, catching up on articles he was peer-reviewing. Just that day, he’d read papers for Marine Biotechnology and the Journal of the American Medical Association, and he’s often amazed at the diversity of the journals that come across his desk. Papers on phylogenetics are just as likely to appear in journals for mathematics, statistics, and computer science as they are in biology journals. Promising applications of the tree of life, such as drug discovery, are drawing many people to the discipline.
“It’s a nice field for people to get into because there’s a lot of action here,” Crandall says. He thinks that now is a good time for people with skills in algorithm construction and data visualization to partner with biologists to make real advances in the field.
Sanderson agrees. “The algorithms are just not keeping pace with the data that are available, so anyone with a better mousetrap is going to have a huge impact,” he says.
Bader hopes that scientists and engineers who want to learn more will visit the Web page for the NSF-funded CIPRes program. At CIPRes, some 40 scientists across various disciplines are developing a national computational infrastructure to support phylogenetics and enable the construction of the tree. He envisions that someday researchers will be able to submit the smaller species trees they’ve constructed to CIPRes, just as they submit genes they’ve sequenced to GenBank.
Asked to dream big about where computing could take phylogenetics in the distant future, Sanderson says he and his colleagues would like to see an automated online system that continuously polls databases such as GenBank and adds the new sequences to trees. “There are so many difficult computational problems along each step of the way that it’s probably a little overly ambitious,” he concedes. “But it’s something that we imagine might be possible.”
You Can be a Phylogeneticist, Too
Anyone can be a phylogeneticist at home by downloading Dogma, a parallel computing program Keith Crandall’s colleagues developed at Brigham Young University. Like the Stanford University programs Folding@Home and Genome@home, Dogma is a screensaver that exploits volunteers’ unused CPU time. Recent Dogma projects included mapping a tree of 2,500 insect species.
About the Authors
Pam Frost Gorder is a freelance science writer based in Columbus, Ohio.
Computing in Science & Engineering
May/June 2005, pp. 3-6, vol. 7
DOI Bookmark: 10.1109/MCSE.2005.48
https://www.computer.org/csdl/magazine/cs/2005/03/c3003/13rRUxjyX7B
David A. Bader
Distinguished Professor, Associate Dean for Research, and Director of the Institute for Data Science
David A. Bader is a Distinguished Professor in the Department of Data Science and Associate Dean for Research in the Ying Wu College of Computing at New Jersey Institute of Technology.